


(*) MASTER NOTES: Time to split
Sep 15 2018
On the Sept. 7 edition of the BaseballHQ Radio podcast, Todd Zola and I discussed how 2018’s ADP first-rounders had fared this year, and specifically if they were likely to be first-rounders again in 2019. As a value guide, I ran the BaseballHQ.com “Custom Draft Guide” (“CDG,” a misnomer, as it is way more useful than just as a draft tool) to check this year’s values, using a 69%-31% hitter-pitcher split.
As we worked through the list of top 2018 performers, we came to the #5 producer, Max Scherzer, who had produced $41 in 5x5 value on the basis of 17 wins, 2.31 ERA/0.88 WHIP and an MLB-best 271 strikeouts. After our brief discussion, in which we agreed that Scherzer (and maybe Jacob deGrom) were worth first-round selections next year, Todd tossed one last thought onto the table.
He said Scherzer’s $40+ valuation is “because of the way we conventionally price players,” meaning the usual 70-30-ish hitter-pitcher split. “If you split it 50-50,” Todd went on, “(he’s) closer to a $70 player.”
OK ... Wait... what? Seventy dollars?
What’s the right hitter-pitcher split?
Setting a hitter-pitcher split is fundamental to establishing player values in leagues with auction-style drafts. Basically, it’s a question of how an owner should allocate the (usually) $260 in his auction wallet. There are three schools of thought on the topic:
70-30(-ish): This is the most common split, in a range of 67/33 to 71/29 or so. It’s widely used because ... well, because it’s widely used. In his excellent book Winning Fantasy Baseball, Larry Schechter says this split is best because varying too dramatically from it—even if the owner believes he has a sound and rational reason—causes that owner to overvalue hitters or pitchers and to undervalue the opposite. The result will be to pay more than necessary for one side at auction, and to not buy enough production from the other.
There can—and are—arguments made for other valuations.
62-38: Schechter himself mentioned this split in his book, because roughly 62% of available Standings Gain Points came from the hitting side. This strikes me as an excellent and logical approach, except the only way to get an accurate SGP split is in hindsight.
60-40: The argument for 60-40 is based on the usual 14 hitter-9 pitcher roster requirement. If 14/23rds of the rostered players are hitters, the argument goes, then 14/23rds of the money should be spent on them. And 14/23rds works out to 60%.
50-50: The justification for this valuation method is that since both hitters and pitcher provide 50% of the stats, both hitters and pitchers should get half the budget.
Differencing the split
To see what the actual variations would be at some of the common splits, I re-ran the CDG, changing the splits from 69-31 to 60-40 and then to 50-50. (The same is true of any valuation engine or draft software that allows the user to adjust the splits, and all the good ones do.) Based on Schechter’s ideas, and my own common sense, I fully expected some of the values to shift around. I wasn’t prepared for how much.
First, here’s the first two rounds of a draft, with dollar values, using the original 69-31 split:
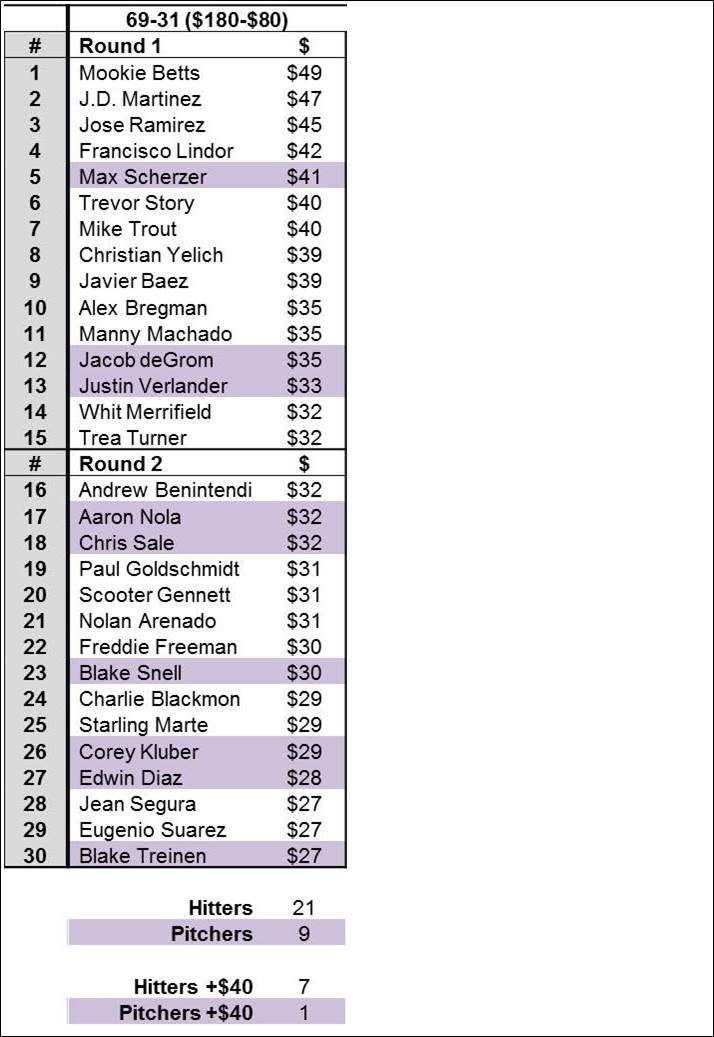
The table shows a pretty normal distribution of player values, with hitters taking up 70% of the top 30 spots, and Betts, Martinez and Ramirez up over $40. Just nine pitchers (including two closers, interestingly), are part of the first two rounds, with Scherzer the only $40+ hurler.
Now the result when the CDG is reset to a 60-40 split, reflecting the 14-9 roster requirement:
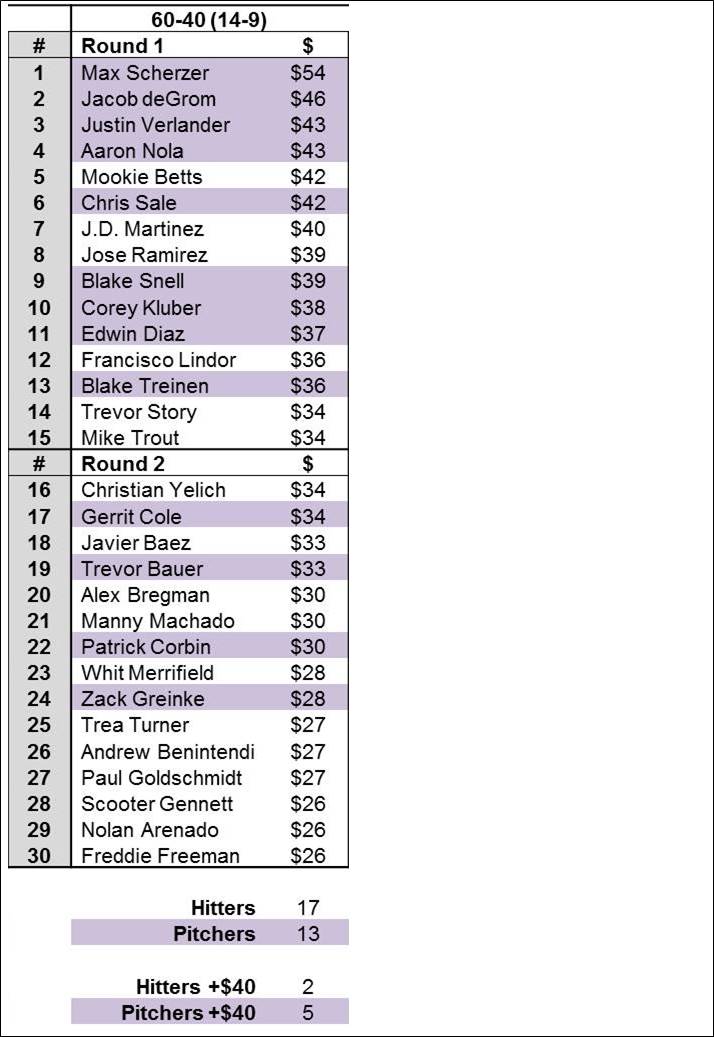
Even though the hitters still command $60 of the budget, there is a huge shift towards pitchers as generators of value. They make up a disproportionate 45% of the top-30 list, and nine of the first-rounders, including all of the top four, are pitchers. Scherzer leads the way, his value now well over $50. Only Betts and Martinez are valued over $40, and hitters are down about $4 apiece across this part of the board.
Finally, the 50-50 split to which Zola referred:
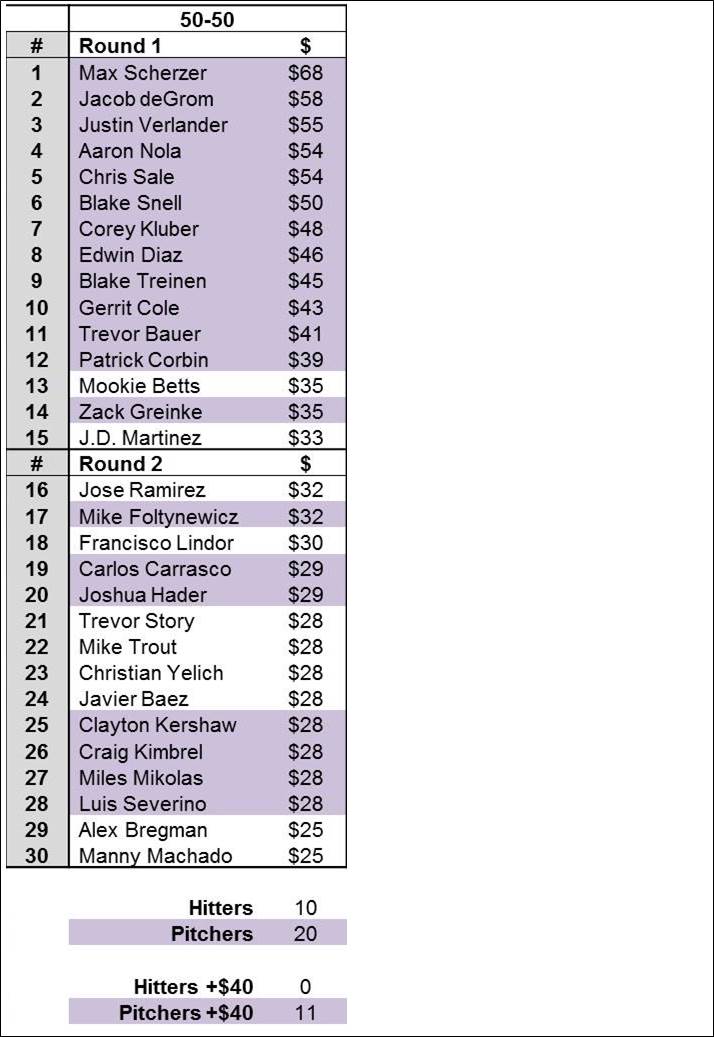
Now the pitchers have taken over the first two rounds, with fully two-thirds of the players by value. Eleven pitchers, including closers Diaz and Treinen, are valued at more than $40. By contrast, no hitter is close to $40, with Betts the top earner at $35 and all the hitters down by $10-$14 from their 69-31 values.
Voting the split
On its face, it seems obvious that there are tremendous market inefficiencies here—if we accept the idea that underpins the 50-50 approach, namely that it is the correct way because pitchers contribute half of the stats. It’s pretty simple to reset splits in the valuation engine so it generates “true” player values that create, or reveal, the inefficiency.
Even so, however, that leaves the paradoxical question of how to exploit the inefficiency. As Schechter notes in his book, using the 50-50 values in a 69-31 world will mean overpaying for pitchers and thereby coming up short on all the top hitters.
It might be that truly believing in the 50-50 split would mean voluntarily giving up the top hitters, and waiting for hitters at the lower reaches, where the value differences compress. For example, while Betts is worth $35 in 50-50, he probably wouldn’t go for so little (if he did, so much the better). But the “overpay” for players lower down is not so egregious—Eduardo Escobar is an $11 value in 50-50, and $16 in 69-31. Justin Smoak is $8 in 50-50, $10 in 69-31. Considering the money probably saved on the top pitchers (by 50-50 standards), there might be enough money to spend a little extra for mid-tier hitters.
It might be even easier in straight-draft leagues. In the first four rounds, the 50-50 owner could grab Scherzer, deGrom, Nola and Diaz, knowing that there would still be targetably useful hitters to come, the Tommy Phams, Jose Abreus, Matt Olsons, Johan Camargos and Nomar Mazaras of the world. There might even be more of them if the other owners start looking nervously at the powerhouse pitching being snapped up by the 50-50 owner and as a result start grabbing up the SP-2 and SP-3 guys earlier than they otherwise might.
It isn’t easy. Using YTD valules to draw up the lists is 100% hindsight, whereas the real world makes us use projections and other forms of educated guesswork. One of the reasons cited by 70-30 budgeters is the inherent added risk in pitcher projections and pitcher performance. (There is widespread disagreement about the level of risk, especially where the Scherzers and deGroms are concerned.) There’s also the game-theory angle that says you could calibrate your higher projected value against the expectation in the ADPs to have your 50-50 cake and eat it too, if you’re the only guy who thinks deGrom is worth a second-round pick, you could grab a Round-2 hitter and get deGrom in Round 3.
After the podcast, I asked Todd Zola about the whole question of balancing 50-50 belief with a 69-31 environment. He said, “Yeah, that’s the problem.” There might be opportunity here, but it remains to be seen how to take advantage.
More From Archives

The e-version of the 2024 Minor League Baseball Analyst is now available to all who have purchased directly from BaseballHQ.com.
Jan 16 2024 6:00pm
Jan 16 2024 6:00pm

Baseball is back soon! And even thought the Hot Stove hasn't seemed to get going, fantasy drafts are happening and there's move to discuss. Join co-GM of BaseballHQ.com Brent Hershey at 12 noon ET for some 2024 talk.
FREE
Jan 15 2024 12:00pm
FREE
Jan 15 2024 12:00pm

The full set of electronic files from Ron Shandler's 2004 Baseball Forecaster are now available for download, if you bought the book direct from BaseballHQ.com. Links inside!
Jan 3 2024 9:00am
Jan 3 2024 9:00am
-300x200.png)
Thursday night, 8pm ET! Join us as we celebrate the hard copy release of Ron Shandler's 2024 Baseball Forecaster.
FREE
Dec 14 2023 8:00pm
FREE
Dec 14 2023 8:00pm

Our first chat of the offseason. Winter Meetings are here, fantasy drafts are underway, and the Baseball Forecaster is a-comin'! Join co-GM of BaseballHQ.com Brent Hershey at 12 noon ET for some early 2024 talk.
FREE
Dec 4 2023 12:00pm
FREE
Dec 4 2023 12:00pm

