

Exploring 2026 category targets
Dec 23 2025
In fantasy baseball discussions, it doesn't take long for statistics to come up. How many home runs is “so-and-so” going to hit this year? How many plate appearances is “blah-blah-blah” going to get? Is there any way “Joe-Schmo” swipes 35 bags again? You may treat your favorite projection system (we're partial to the Baseball Forecaster around these parts) as one of Nostradamus' lost texts, with an ardent belief that you are, in fact, reading a ledger of what has already happened; or you might reside on the other end of the spectrum and think that any projection is relatively meaningless. No matter where you land on the value of projections in general, we can likely all agree that we'll need to achieve some amount of each stat (depending on what our specific league deems worthy) to help us win our leagues next season.
Individual player forecasts aside, there is some reliability in predicting the category totals we need to achieve to be competitive. Furthermore, as you allot your precious draft capital, whether it be in the form of draft picks or auction dollars, you want to get the most bang for your buck. Understanding category targets helps us do just that; it provides a framework for comprehending how market dynamics affect the supply and demand for various resources.
When MLB rule changes caused stolen bases to jump 41% in 2023, we later found out it didn't necessarily make category-specific rabbits more valuable. Since many more guys were getting the green light, it meant that getting speed at each position was more important. Understanding how much of each resource we need enables us to be more efficient with those draft dollars. When we have a concept of what percentage of the projected available supply we must scoop up, we can better strategize how to build a roster that accomplishes that end goal.
So, if we can agree that knowing general goals for each category is valuable, then where do we get these numbers? If you play in a home league, simply look at the last few seasons of your league history to get a general feel for what you need in each category. Since around 120 total points (15-team) or 100 points (12-team) should put you in a strong position to win your 5x5 rotisserie league, a good rule of thumb is to shoot for 4th-place category finishes (in 15-team leagues) and 3rd-place finishes in 12-teamers.
In this article, we'll look at data from the National Fantasy Baseball Championship (NFBC), as its site provides public data for all its contests. We'll look at both 15-team data from the Main Event and 12-team data from the Online Championship, which are both FAAB leagues. The NFBC data was pulled using phantasea.io, a site created by Stephen Goodwin. It's an invaluable site for those who enjoy digging deeper into data and trends; I highly recommend checking it out.
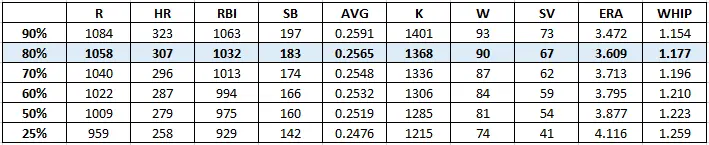
First, let's look at the outcomes in the NFBC 2025 Main Event. This breaks down the 90th percentile (around a first-place finish in the category), the 80th percentile (around a fourth-place finish), and so on. Bear in mind that “first-place” does not represent what the team that finished first in the league did, but rather the average finish in each category.
5x5 Rotisserie Categories (15-team):
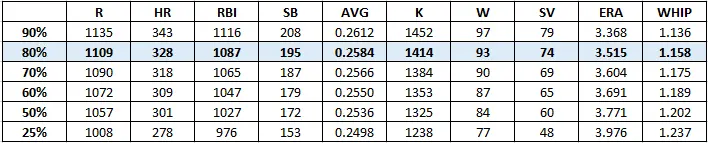
And then, the results from the 2025 Online Championship. Since the relevant player pool is shallower, we should expect the relative averages to be higher, and they are. Once again, the 90th percentile represents a 1st-place finish, and the 80th percentile captures a 3rd-place average.
5x5 Rotisserie Categories (12-team):
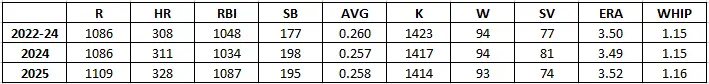
When looking back at our category targets article from last year, we notice a couple of things. The “three-year average” was pulled from last year's article (covering 2022-2024). The box below outlines how last year's results compare with previous years.
15-team:
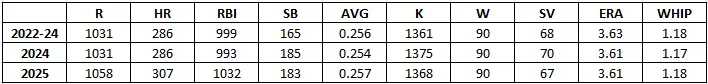
This box shows the change (in 15-team leagues) from 2024 to 2025:

12-team:
And again, the change (in 12-team leagues) from 2024 to 2025:

We can see that power was on the rise last season, at least in the fantasy-relevant player pool(s). The continued unpredictability in bullpen usage caused drops in both, affecting 12-team leagues more heavily, as it takes less MLB bullpen chaos to cause a greater ripple effect when the player pool is shallower.
While the exact totals you'll need for your upcoming league(s) aren't known, the above information can inform an overall plan as you identify specific player acquisitions to build an optimal roster. Category targets are not the end-all, be-all of draft preparation - as no “one thing” generally is - but they often play a vital role for many successful managers as they strategize their attack for taking down championships. Good luck with your drafts over the next few months!
More From Rotisserie
Mar 20 2026 2:57am
Five takeaways from the Tout Wars Mixed Draft in early March
FREE
Mar 16 2026 3:02am
FREE
Mar 16 2026 3:02am
Pitchers who didn't quite make the Santana Plan filters
Mar 7 2026 3:08am
Mar 7 2026 3:08am
Planning and execution of your draft strategy is key. Here's one example of how it's done, fresh out of Arizona.
Mar 7 2026 3:06am
Mar 7 2026 3:06am
Mar 6 2026 3:06am

