


(*) DAILY MATCHUPS: Scherzer, Paxton, Severino top Friday's list
May 25 2018
As a way to preview the day's games, the 2018 Daily Matchups column will provide a list of all SP scheduled to start that day as identified by the HQ Pitcher Matchup tool (also available as an 8-day scan). It will group the day's SP into strong starts, judgment calls, or weak starts and will provide an analysis of the most noteworthy SP along the way.
For additional DFS coverage collected in one place, see our Daily Dashboard page. Also reference our three-year ballpark factors, team indicator pages, and SP Buyers Guide columns to help you optimize your SP utilization.
***
Today's schedule overview: Friday's full slate features six NL matchups, six AL matchups, and three interleague matchups, which will add a DH to Atlanta and Arizona while Toronto will lose a DH position. The SF at CHC is the only afternoon game (2:20 PM EST), and three matchups start the evening slate at 7:05 PM (EST). The slate has clear forecasts with the wind forecasted to be blowing out in Chicago and Boston. Be sure to check updated weather forecasts closer to first pitch on Friday.
***
Strong Starts (top tier starts rated >1.0; starts in 0.50-0.99 range also favorable)
| SP | Tm | Opp | RAT | K | ERA | WHIP | WIN | L5 PQS | |
| Max Scherzer | WAS | @MIA | 3.80 | 4.90 | 3.42 | 4.02 | 2.85 | 4 4 5 4 4 | |
| James Paxton | SEA | vMIN | 2.32 | 3.21 | 1.93 | 2.48 | 1.64 | 3 5 4 1 4 | |
| Luis Severino | NYY | vLAA | 2.02 | 2.69 | 1.70 | 2.14 | 1.53 | 4 5 3 4 3 | |
| Noah Syndergaard | NYM | @MIL | 1.76 | 2.40 | 1.32 | 2.05 | 1.25 | 5 2 1 3 5 | |
| Kyle Hendricks | CHC | vSF | 1.74 | 1.10 | 1.70 | 2.02 | 2.15 | 5 3 4 2 3 | |
| Corey Kluber | CLE | vHOU | 1.70 | 2.17 | 1.76 | 2.38 | 0.47 | 4 4 2 3 4 | |
| Ross Stripling | LA | vSD | 1.53 | 0.88 | 2.20 | 2.14 | 0.91 | 0 2 3 4 | |
| Patrick Corbin | ARI | @OAK | 1.41 | 1.71 | 1.69 | 1.66 | 0.58 | 3 2 3 3 2 | |
| Jonathan Gray | COL | vCIN | 1.29 | 1.69 | 1.02 | 1.31 | 1.14 | 4 4 5 2 2 | |
| Ryan Yarbrough | TAM | vBAL | 0.57 | 0.14 | 0.39 | 0.94 | 0.79 | 2 2 0 | |
| Eduardo Rodriguez | BOS | vATL | 0.51 | 0.77 | 0.10 | 0.81 | 0.35 | 2 3 3 1 3 |
Ross Stripling (RHP, LA) is a strong start option with a matchup against the Padres' bottom-five offense vs. RHP. In a May 6 start vs. SD in Mexico, the right-hander struck out five in four scoreless innings. As his pitch counts have increased, he has had success. On May 19, he held the Nationals to one ER in six IP for a PQS-4. His strong ratio ratings should pair nicely with some strikeouts, as the Padres have a 26.2% K%.
Patrick Corbin (LHP, ARI) is having an impressive season with an 11.7 Dom and 2.69 xERA. Monitor his velocity drop to 89.4 MPH in four May GS, as more walks and fly balls have contributed to his 3.83 xERA in May. While his exit velocity allowed on FB/LD has increased in 2018, inducing ground balls and throwing more FpK can help against Oakland's below-average lineup vs. LHP.
Jonathan Gray (RHP, COL) has posted stronger skills in 2018. He's missing more bats with his slider (18% SwK) and curveball (19% SwK), which have contributed to his 10.2 Dom. Throwing more first-pitch strikes and his 2.1 Ctl boosts his WHIP rating. While allowing harder contact (92.6 MPH on FB/LD) adds risk, a shift in fortune should move his ERA closer to his 3.35 xERA. The Reds have been a below-average lineup vs. RHP in 2018.
Ryan Yarbrough (LHP, TAM) is slated to come in the game for Sergio Romo against Baltimore. In a May 19 stint at LAA, the lefty struck out four and allowed one ER in 6.1 IP. His chance for a win increases with a relief outing, and Baltimore has been an average offense vs. LHP.
Eduardo Rodriguez (LHP, BOS) has posted seven PQS-DEC results in nine GS, and his change-up (24% SwK) has created more swings and misses in 2018. Unfortunately, he takes on a Braves lineup that owns a major-league leading .834 OPS vs. LHP. While his 3.0 Ctl and 42% GB% have boosted his skills in 2018, a difficult opponent slides him toward the bottom of the strong starts.
Judgment Calls (Overall ratings from -0.50 to 0.50)
| SP | Tm | Opp | RAT | K | ERA | WHIP | WIN | L5 PQS | |
| Sean Manaea | OAK | vARI | 0.45 | 0.92 | 0.77 | 1.19 | -1.08 | 5 2 1 1 0 | |
| Mike Minor | TEX | vKC | 0.37 | 0.72 | 0.33 | 0.56 | -0.15 | 2 0 2 1 2 | |
| Eric Skoglund | KC | @TEX | 0.30 | 0.82 | 0.20 | 0.51 | -0.35 | 4 1 3 4 0 | |
| Dallas Keuchel | HOU | @CLE | 0.28 | 0.07 | 0.97 | 0.97 | -0.90 | 2 4 3 5 0 | |
| Clayton Richard | SD | @LA | 0.20 | 0.58 | 0.97 | 0.17 | -0.91 | 3 1 5 5 3 | |
| John Gant | STL | @PIT | 0.02 | -0.30 | 0.25 | 0.52 | -0.40 | 2 3 | |
| Mike Fiers | DET | vCHW | -0.03 | -0.30 | -0.29 | 0.62 | -0.15 | 3 0 2 3 0 | |
| Reynaldo López | CHW | @DET | -0.08 | 0.26 | -0.43 | 0.21 | -0.35 | 1 2 4 0 5 | |
| Joe Musgrove | PIT | vSTL | -0.10 | -1.43 | 0.44 | 0.68 | -0.10 | ||
| Sam Gaviglio | TOR | @PHI | -0.21 | -0.47 | -0.53 | 0.00 | 0.17 | 3 | |
| Andrew Heaney | LAA | @NYY | -0.27 | 1.34 | -0.55 | 0.28 | -2.15 | 3 2 3 5 2 |
Sean Manaea (LHP, OAK) will try to avoid throwing his fourth-consecutive PQS-DIS with a start versus Arizona's above-average offense vs. LHP. While the lefty has missed fewer bats and lost some strikeouts (5.6 Dom) in four May outings, the Diamondbacks have the fourth-highest K% vs. LHP. His 43% GB% can help, but his 3.65 xERA says that correction is coming in seasonal leagues.
Mike Minor (LHP, TEX) carries a 6.92 ERA in his last five GS into a start against the Royals, who have been an average offense vs. LHP. While the lefty has offered league-average strikeouts, the Royals own the lowest K% in the majors. His 2.0 Ctl leads to a decent WHIP rating, and his 4.10 xERA says that he can provide some ratio support.
Eric Skoglund (LHP, KC) has given up more home runs and harder contact in eight GS. Throwing 64% FpK and his 2.4 Ctl can help WHIP. The Rangers have the second-highest K% vs. LHP in the majors, which could boost his 6.9 Dom. RHH could be worth a start, as they own a .901 career-OPS against the southpaw.
Dallas Keuchel (LHP, HOU) faces Cleveland for the second time in a week. On May 19, allowing four ER and five hits in five IP vs. CLE resulted in a PQS-0. The Indians have been a top-five offense vs. LHP. Although his low K rating and 6.9 Dom give up some strikeout value, his 3.43 ERA and 1.14 WHIP back his ability to lower ratios.
Clayton Richard (LHP, SD) keeps the ball on the ground with a 54% GB%, but hitters have increased their exit velocity to 96.1 MPH on FB/LD against the lefty. His 3.73 xERA, ERA rating, and a matchup with the Dodgers' bottom-five offense vs. LHP could help his cause. In four May starts, he has missed more bats (13% SwK) and has a 2.82 xERA.
Mike Fiers (RHP, DET) has some ERA risk with a 4.65 xERA and 36% hard-contact rate. Throwing consistent first-pitch strikes and issuing fewer walks improves his WHIP rating, but the drop in strikeouts cuts into his value. Although the White Sox have been an above-average offense vs. RHP, he threw six shutout innings at CHW on April 8 for his only PQS-DOM of 2018.
Reynaldo López (RHP, CHW) had success on April 8 versus Detroit's below-average offense vs. RHP, as he threw seven scoreless innings. His fly-ball tilt and 5.19 xERA add ERA risk. Although his newly-added slider (14% SwK) has missed bats, his strikeout totals have fluctuated from zero to eight in his last four GS.
Joe Musgrove (RHP, PIT) is scheduled to return from the DL to face a Cardinals lineup that has provided league-average production vs. RHP. In 2017, RHH had more success against the right-hander with an .829 OPS. Monitor his velocity in his first start back. In 2017, his 64% FpK and 45% GB% contributed to a 4.09 xERA.
Andrew Heaney (LHP, LAA) has gotten better results with a 1.38 ERA and 1.04 WHIP in four May starts. A matchup against the Yankees' second-best offense vs. LHP and their ace lower his ERA and Win ratings. He has created swings and misses with his curveball and change-up, and inducing more groundballs with his change-up has contributed to his 3.44 xERA.
Weak Starts (Overall ratings -0.51 and below)
| SP | Tm | Opp | RAT | K | ERA | WHIP | WIN | L5 PQS | |
| Zach Eflin | PHI | vTOR | -0.52 | 0.10 | -1.17 | -0.35 | -0.67 | 2 5 2 | |
| Julio Teheran | ATL | @BOS | -0.56 | -0.15 | -0.75 | -0.19 | -1.16 | 1 5 4 1 0 | |
| Junior Guerra | MIL | vNYM | -0.63 | 0.36 | -0.63 | -0.49 | -1.75 | 4 0 2 2 2 | |
| Fernando Romero | MIN | @SEA | -0.64 | 0.01 | -0.39 | -0.40 | -1.79 | 3 4 3 1 | |
| José Ureña | MIA | vWAS | -0.92 | -0.38 | 0.02 | 0.04 | -3.35 | 5 3 3 2 2 | |
| Sal Romano | CIN | @COL | -1.00 | -0.51 | -0.84 | -1.02 | -1.64 | 0 1 4 1 1 | |
| David Hess | BAL | @TAM | -1.05 | -0.62 | -1.09 | -1.10 | -1.39 | 1 0 | |
| Derek Holland | SF | @CHC | -1.50 | -0.57 | -1.65 | -1.44 | -2.32 | 1 2 0 4 1 |
Zach Eflin (RHP, PHI) has punched out 17 batters in 17 IP, and his velocity has increased to 94.4 MPH. Even though his 1.56 ERA is supported by a fortunate H%/S% combination, his 4.24 xERA is serviceable in deeper leagues. While he has a 53% FB% through three starts, his hard contact allowed has dropped in 2018. Toronto has been an average offense vs. RHP.
Fernando Romero (RHP, MIN) toes the rubber against a Mariners lineup that has provided average production vs. RHP with the fifth-lowest K% vs. RHP. Through four starts, the right-hander has struck out 22 hitters in 22 IP while walking 11 hitters. His 4.6 Ctl could elevate WHIP, and his mound opponent lowers his chance for a win.
***
ALL NEW FORMAT FOR 2018!
Our Starting Pitcher Matchup Scores algorithm has been completely revamped for 2018. Based on this research piece from Arik Florimonte, we now calculate a pitcher's individual Matchup Score for a single start by first calculating an individual score representing his potential performance for each rotisserie category, and then rolling those into an overall rating for the day's start.
This rating assesses each starter's outlook on a given day, taking into account the pitcher’s inherent ability, recent performance, strength of defense, ballpark, and opposition’s offense recent history.
There are roughly 150 starting pitchers in MLB rotations at any given time. For different league sizes, we can estimate the number of SP in the useable pool, and then determine the overall ratings that correspond to worst, 25th percentile, median, and 75th percentile SP.
                 Overall SP Rating
                    SP      by SP league percentile
League size       Pool*     .00    .25    .50    .75
==============    =====    ====   ====   ====   =====
12-team “only”     120     -.73   -.22   +.22   +.74
10-team “only”     110     -.54   -.11   +.30   +.79
20-team mixed      110     -.54   -.11   +.30   +.79
15-team mixed      105     -.46   -.05   +.34   +.82
12-team mixed       80     -.07   +.22   +.55   +.97
10-team mixed       60     +.22   +.46   +.74   +1.12
So if you’re in a 12-team “only” league, the median start should have a rating of about 0.2. The 120th start is around -0.7. In a shallower, 15-team mixed, the median start is 0.34 and a top pitcher +0.82.
More From Daily Matchups
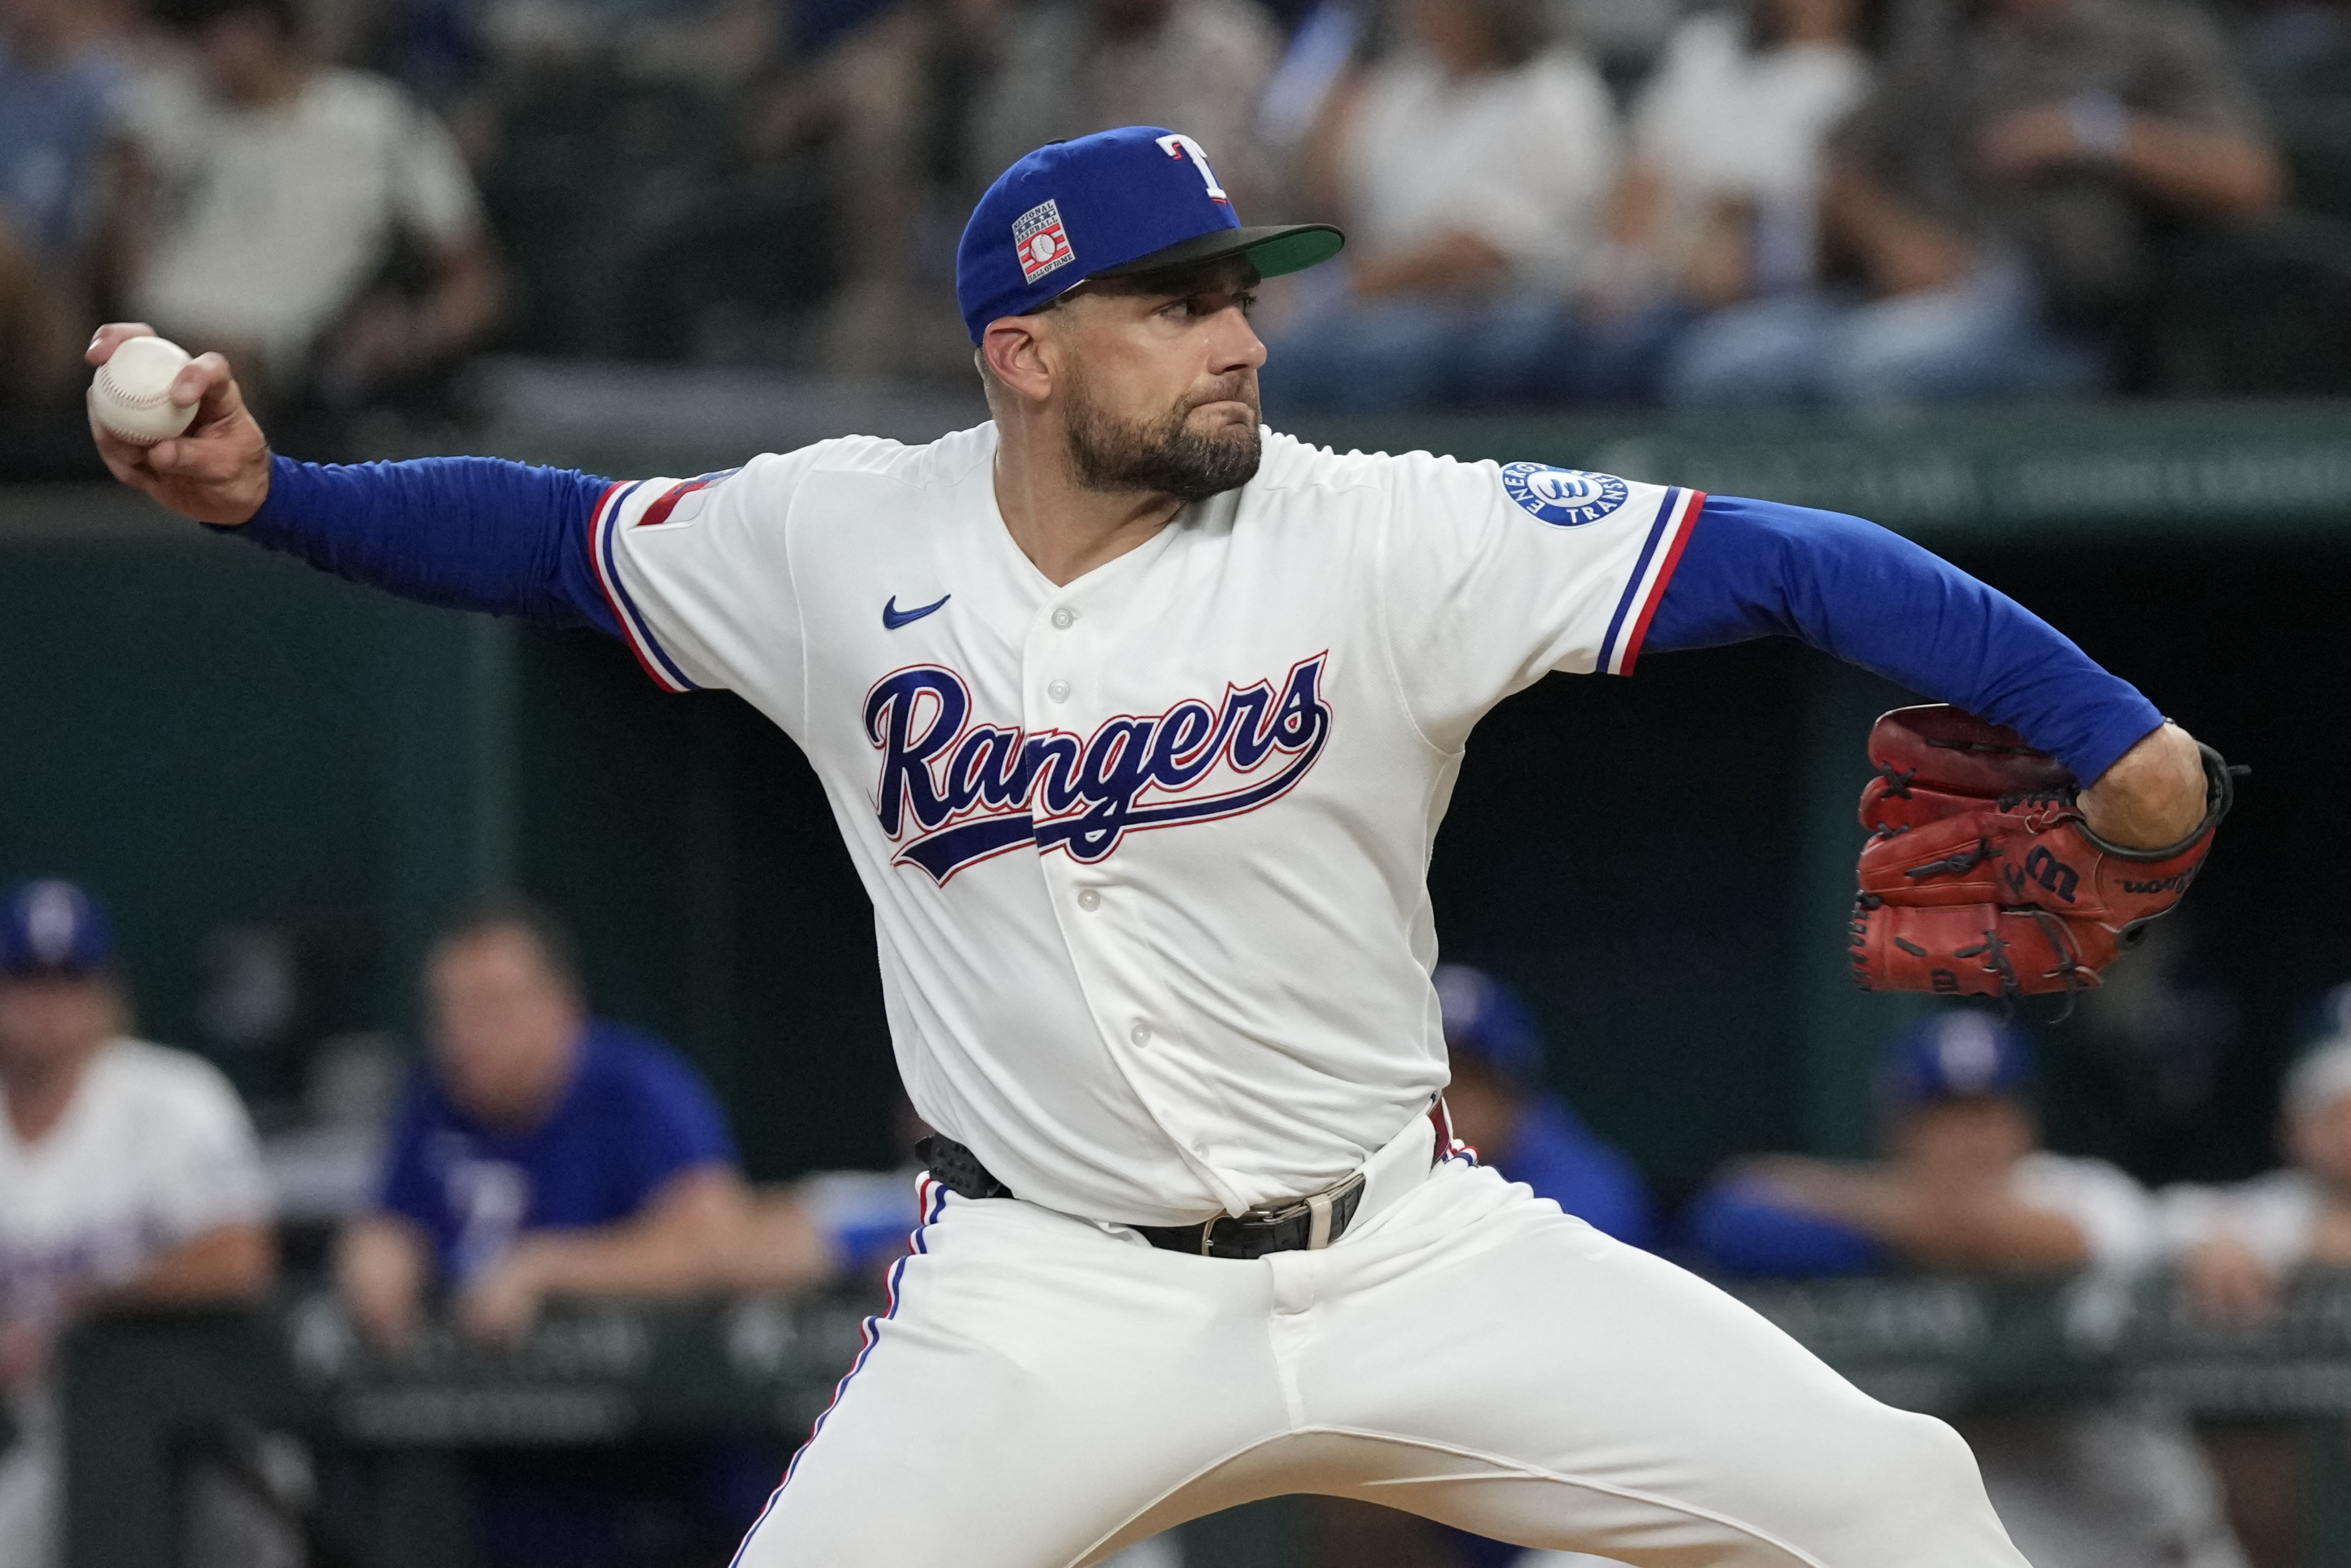
Nathan Eovaldi looks to stay hot versus their Lone Star rivals.
Jul 31 2026 7:37am
Jul 31 2026 7:37am
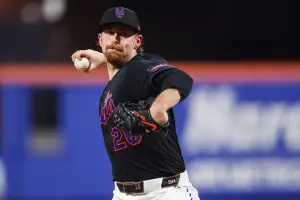
The Mets hurler has good numbers against the Marlins.
Jul 30 2026 8:03am
Jul 30 2026 8:03am
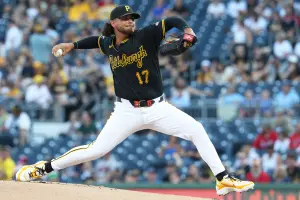
Jared Jones has been pitching great of late and looks to continue that success versus the DBacks.
Jul 29 2026 8:30am
Jul 29 2026 8:30am
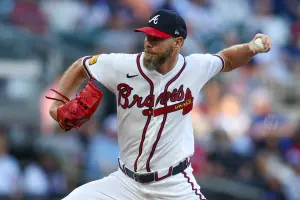
Chris Sale draws a start against a Mets club that has been struggling vs. LHPs, headlining an overflowing slate of action on Tuesday.
Jul 28 2026 7:39am
Jul 28 2026 7:39am
Keider Montero is a top rated starting pitcher for his home start versus the Orioles.
Jul 27 2026 8:00am
Jul 27 2026 8:00am

