Home-road splits, 2026 updated
Aug 17 2026
Identifying the home/road splits of batters can help you maximize your lineups. In addition, they can help you find hidden production that could blossom in the future.
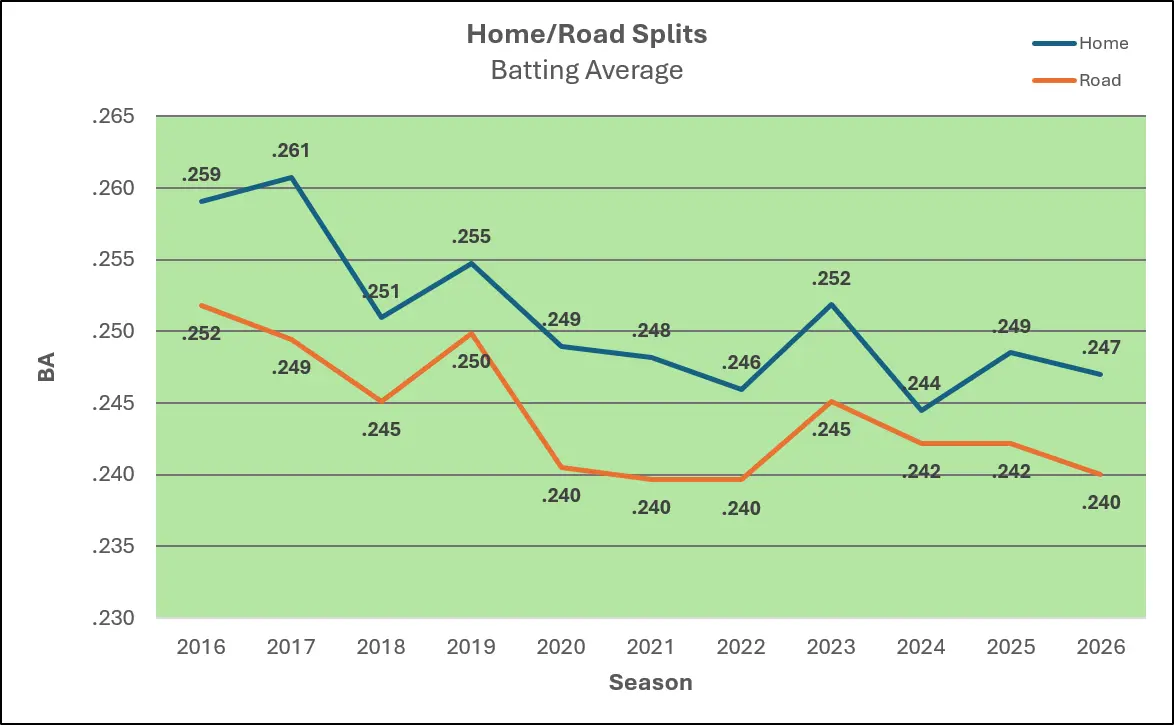
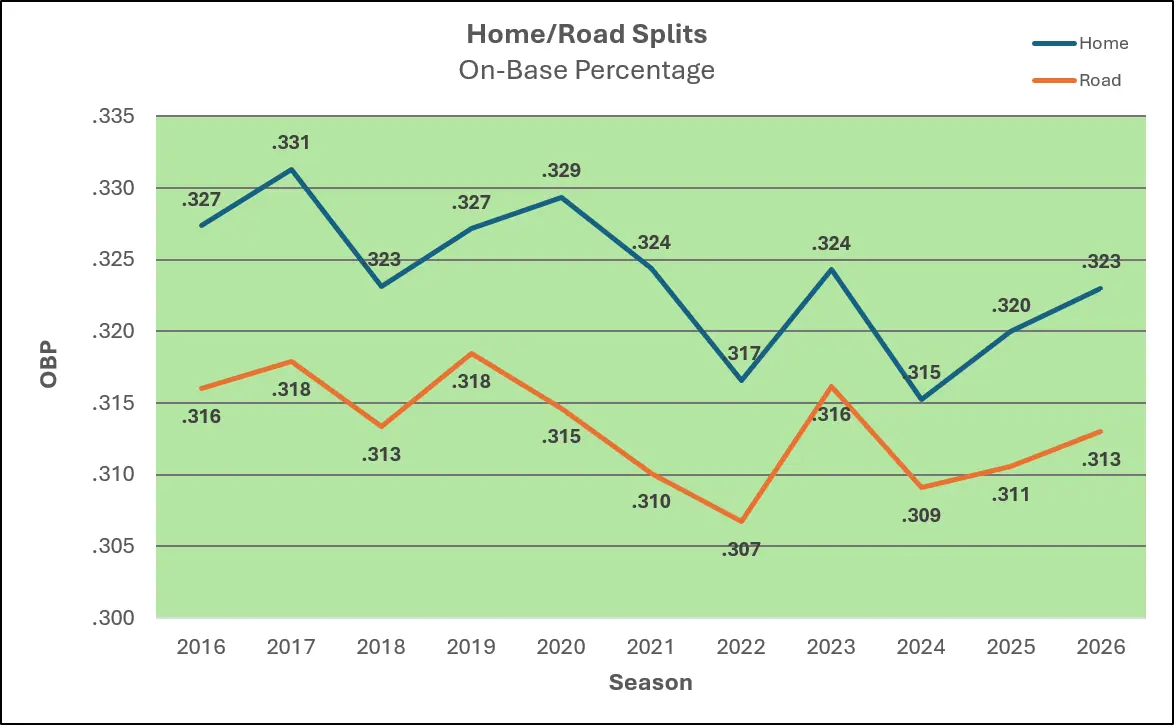
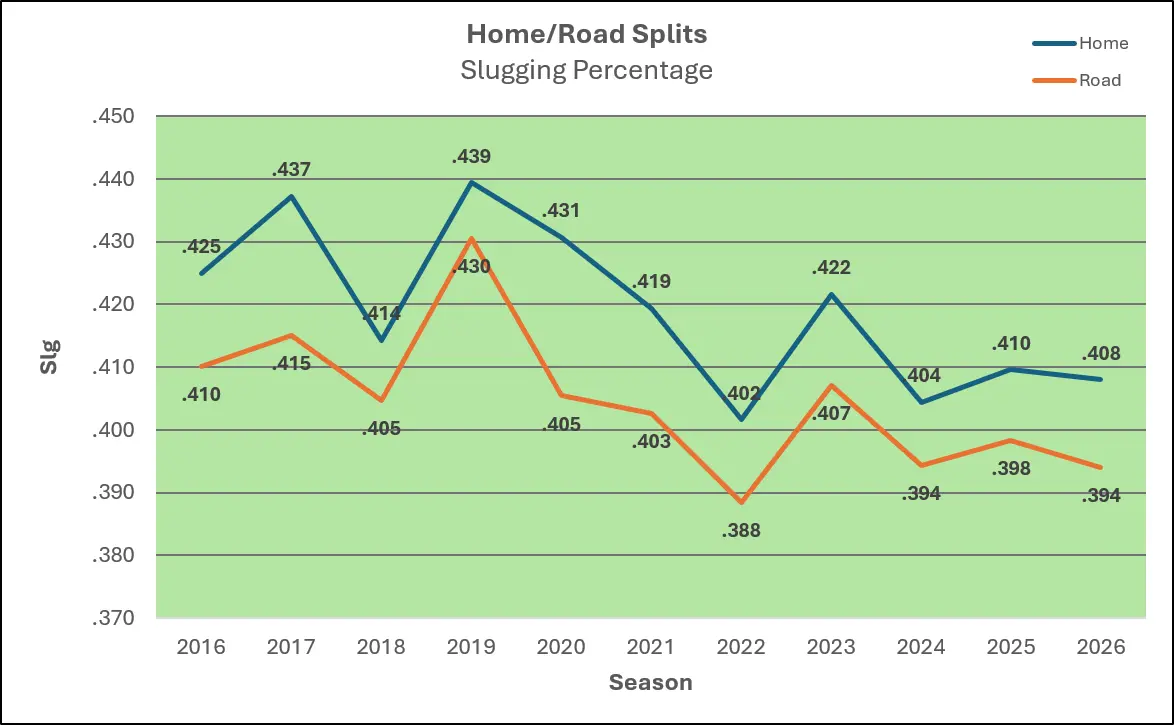
Over the past decade, rate metrics like BA, OBP, and Slg all have been consistently higher when batters hit at home compared to on the road:
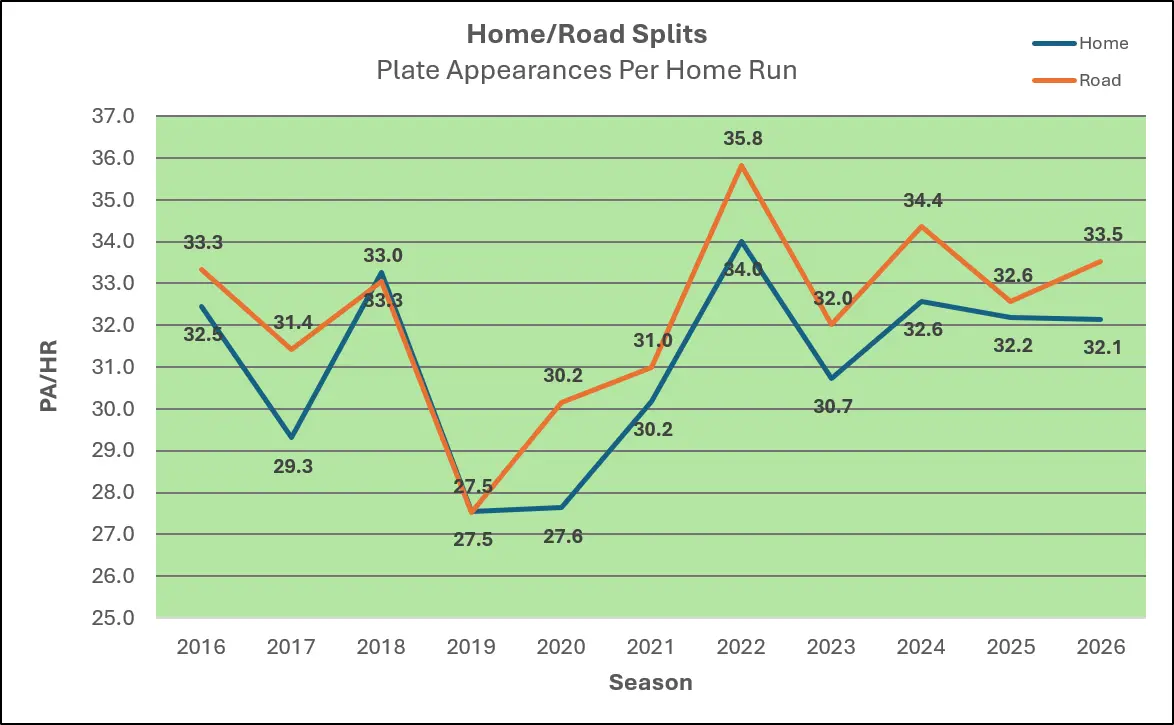
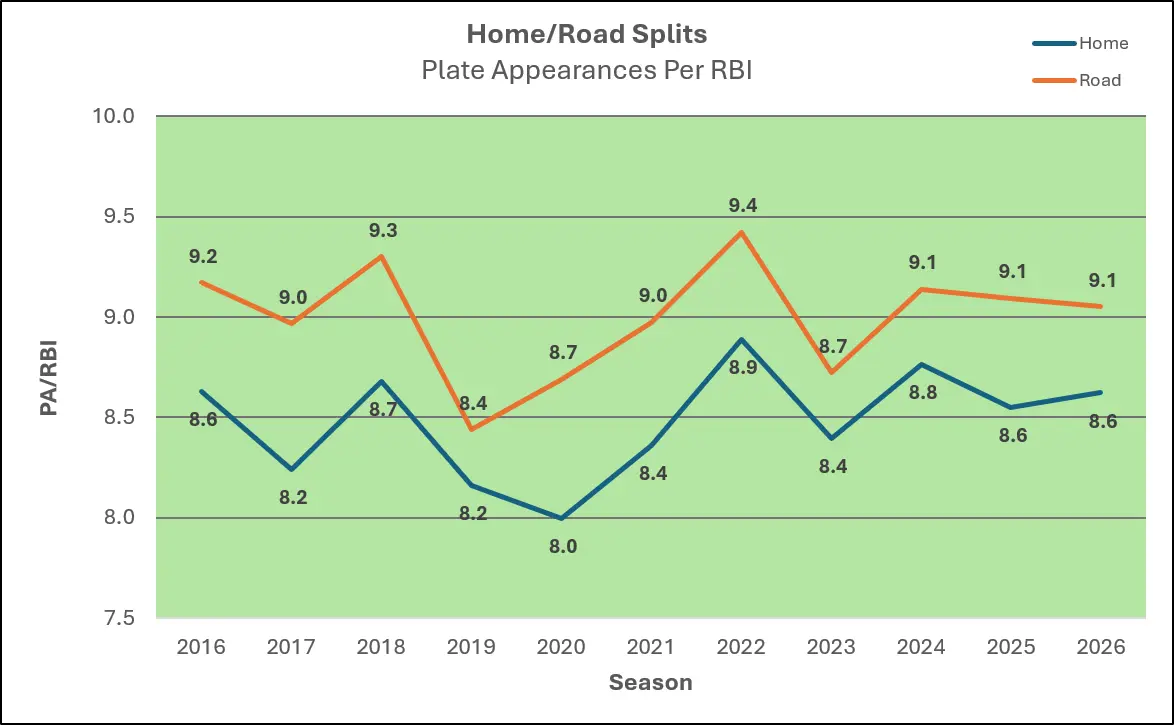
Further, the length of time it takes for batters to hit a home run or generate an RBI has been consistently shorter when they play at home:
At an individual level in 2026, these batters have shown the widest home/road OPS splits so far in 2026 (min 50+ PA home/road):
| Home | Road | Δ | ||||||||
| Name | Lg | ct% | OPS | EV | ct% | OPS | EV | ct% | OPS | EV |
| Jake Rogers | AL | 74% | .899 | 90.4 | 59% | .345 | 85.1 | 15% | .555 | 5.3 |
| Griffin Conine | NL | 69% | 1.157 | 93.1 | 61% | .700 | 92.3 | 8% | .457 | 0.8 |
| Alika Williams | AL | 72% | .915 | |||||||
Almost!
You’re just a few clicks away from accessing this feature and hundreds more throughout the year that have a singular goal in mind: Winning your league. Subscribe to BaseballHQ.com here!
Already a subscriber? Sign in here
More From Batters
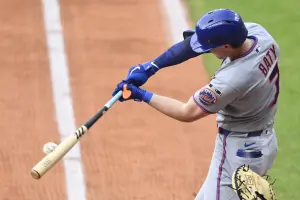
Brett Baty's late-season growth in batted-ball quality and plate discipline makes him an intriguing target for 2027.
Sep 21 2026 3:08am
Sep 21 2026 3:08am

Jac Caglianone was the game's most productive bat in August due to some premium batted-ball skills.
Aug 31 2026 3:15am
Aug 31 2026 3:15am

Alec Burleson's elite stats and skills against RHers and struggles vs. LHers suggest he hasn't maxed out his results yet.
Aug 24 2026 3:15am
Aug 24 2026 3:15am
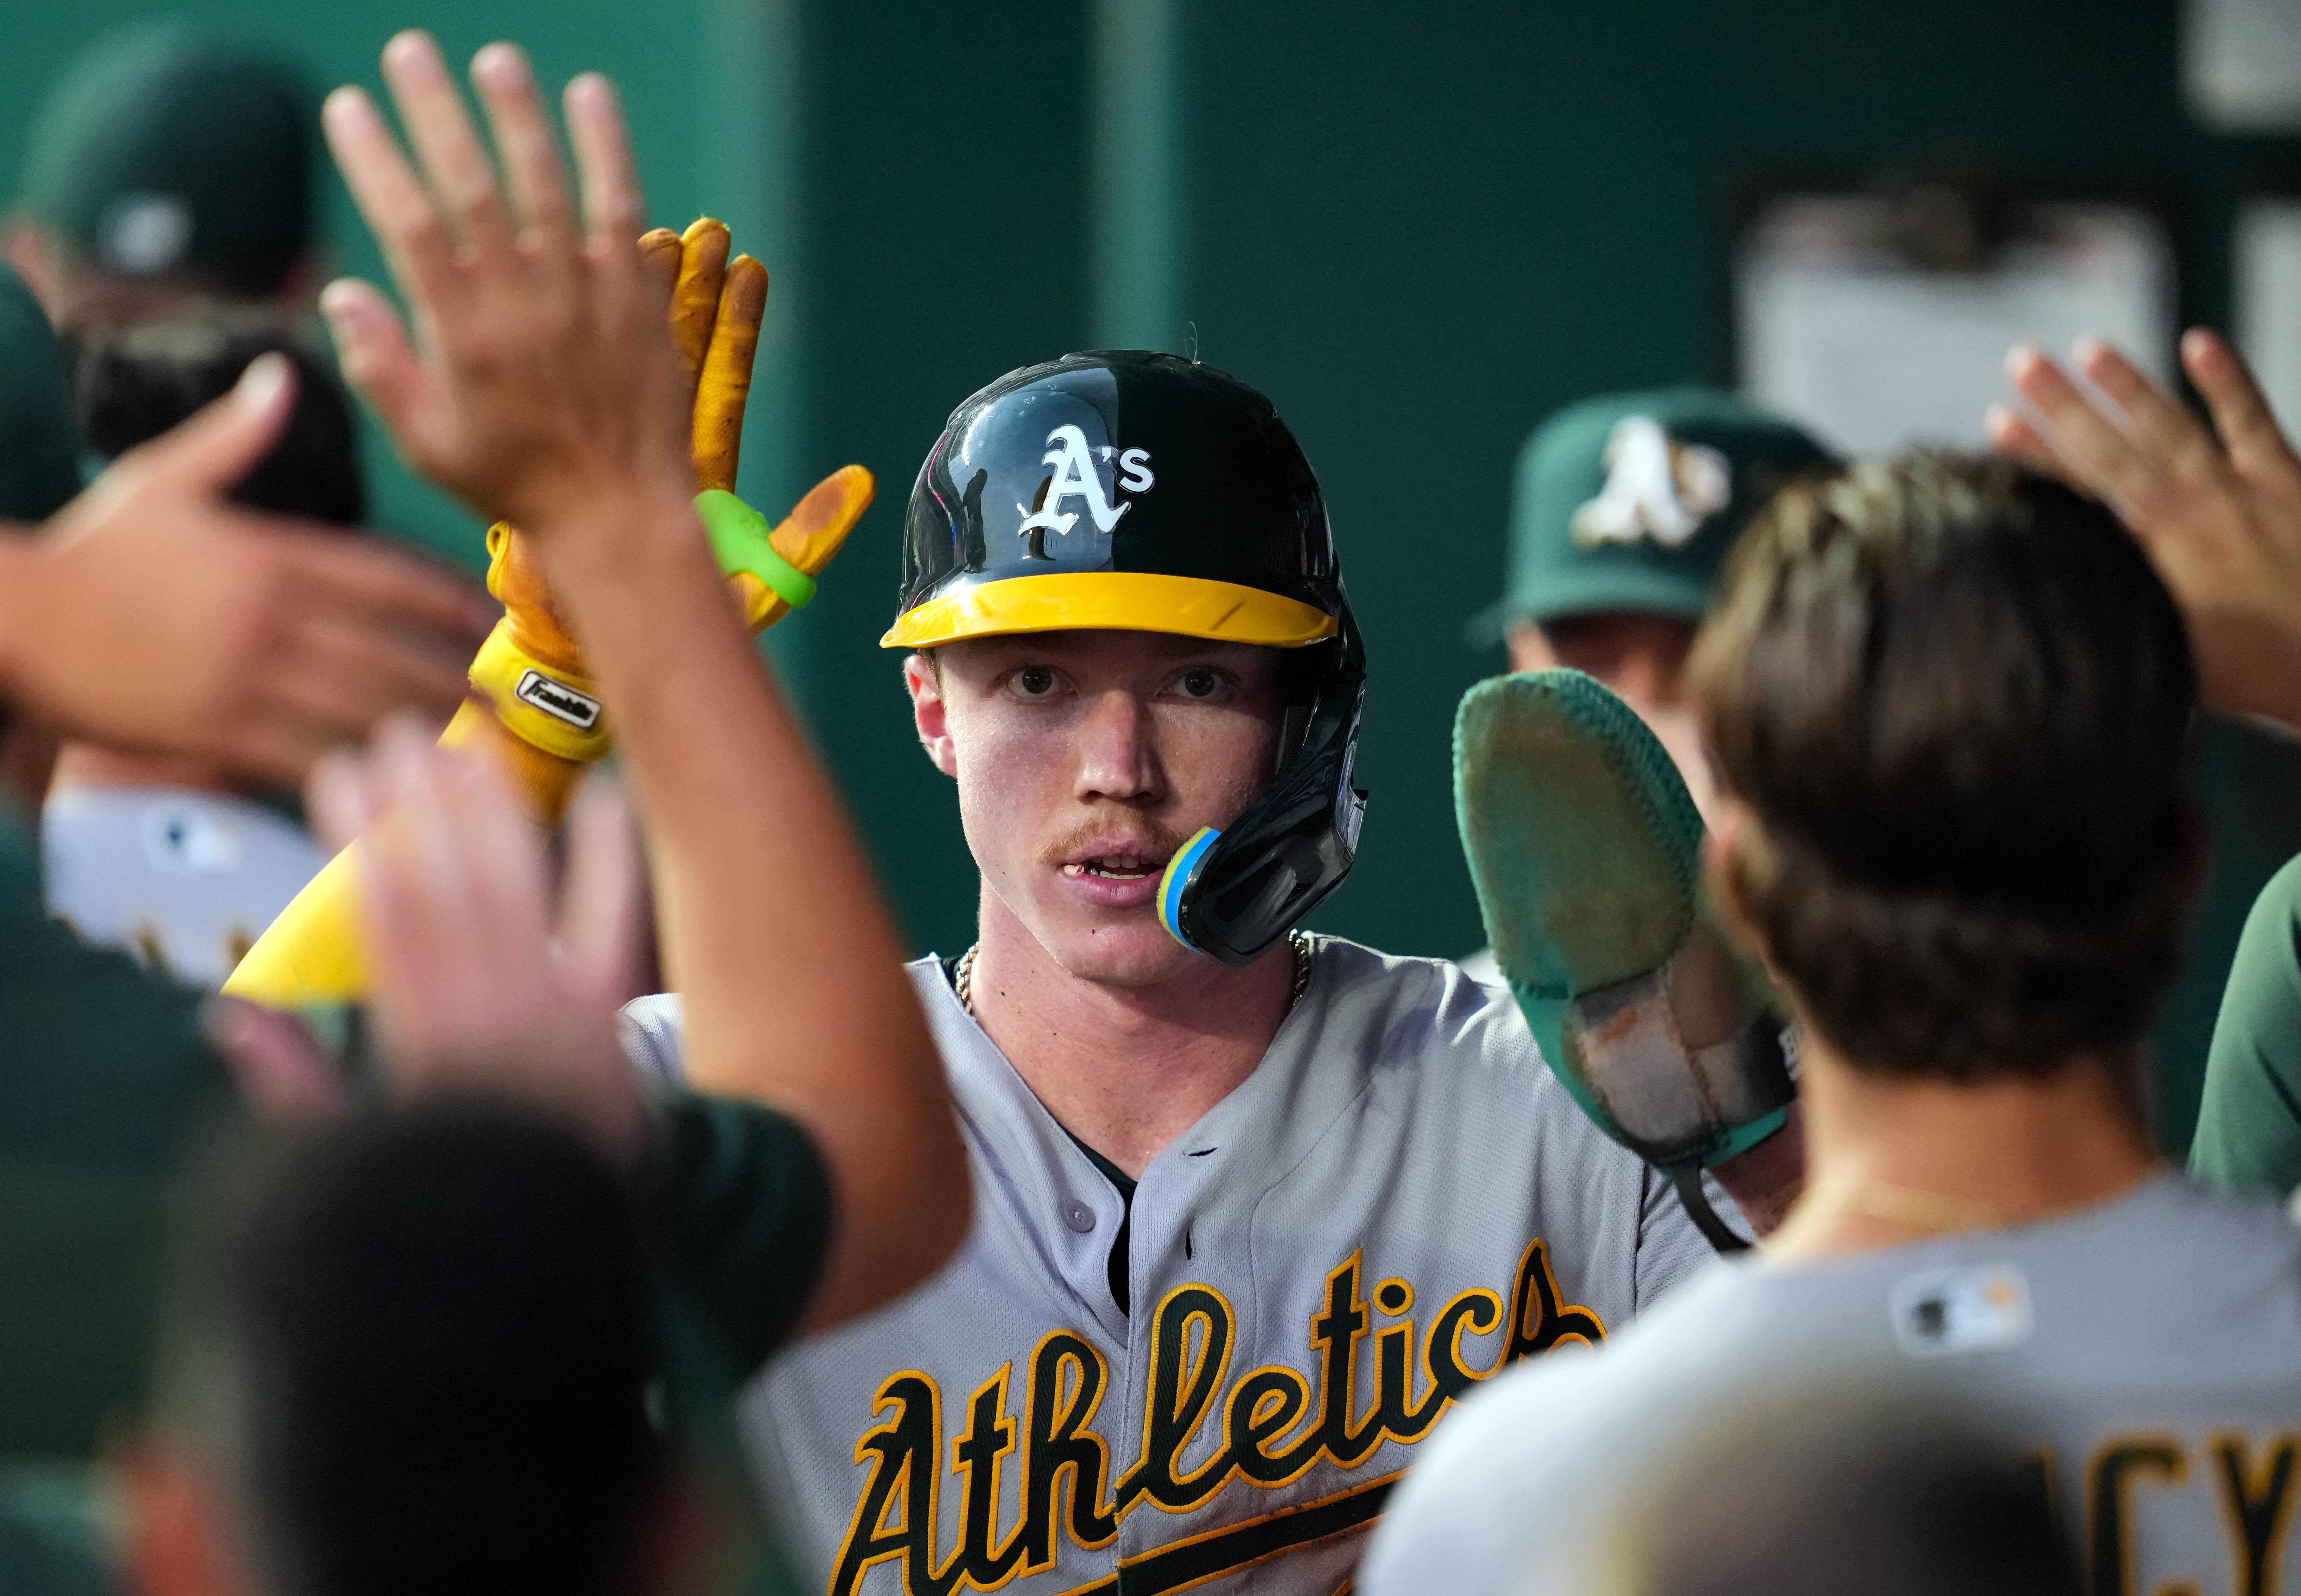
Henry Bolte and Chandler Simpson are leading off for their respective teams, and were we too high on Max Clark?
Aug 21 2026 3:06am
Aug 21 2026 3:06am

Royce Lewis looks like an elite bat in stretches, including during the heater he's been on since returning from the minors.
Aug 10 2026 3:07am
Aug 10 2026 3:07am