


(*) GM's OFFICE: Mid-season validation of SP Matchups tool
Jul 13 2018
Back in April, I did a preliminary validation of our new-for-2018 SP Matchups tool. The results were very encouraging. But because I was so anxious to validate the tool, we used a pretty sketchy sample size: about 10 days worth of April games, some 230ish pitcher starts. Pleased as I was with the results, I promised to check back later in the season with a more representative data set.
So, here I am again, now armed with a full half-season's worth of data—literally 10 times the number of pitcher starts that we had for the April exercise.
We're all about showing our work here at BaseballHQ.com, so let's go under the hood with my favorite new toy on the site. I won't bury the lede: the news here is good.
Re-validation of April results
Let's start by repeating the checks I did in April, before we branch out to new applications.
As a refresher, in the first study, I measured our Matchup ratings against two other metrics:
- PQS: our old friend and the former driver of the Matchup Score, this is a handy and easy-to-use comparison tool for the Matchup Score.
- DraftKings point total: the DK points formula for SP is another handy metric for measuring this tool. Particularly since the Matchup Score has obvious DFS applications, measuring it against the scoring system that a DFS site uses for pitchers should be interesting.
For reference, DraftKings' pitcher scoring system is as follows:
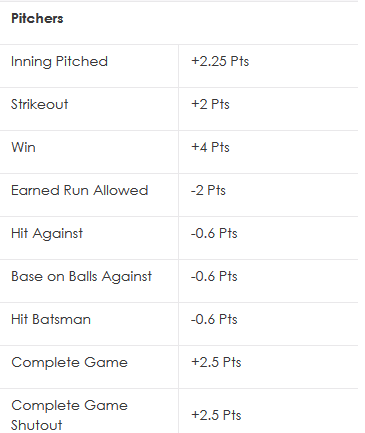
For this exercise, we'll ignore the CG and CG SHO bonuses (there's also a no-hitter bonus, not pictured),
Our approach here is to chunk the entire pool of pitcher starts into ranges based on the overall Matchup Score, and calculated the average PQS and DK score for each range:
| Ranges | count | AvgPQS | AvgDK | |
| Rating 2.0+ | 125 | 3.34 | 23.28 | |
| Rating 1.5 to 1.99 | 118 | 3.03 | 21.20 | |
| Rating 1.0 to 1.49 | 227 | 2.61 | 17.90 | |
| Rating 0.50 to 0.99 | 341 | 2.46 | 15.90 | |
| Rating 0.0 to 0.49 | 451 | 2.19 | 13.78 | |
| Rating -0.50 to -0.01 | 485 | 2.16 | 13.57 | |
| Rating -1 to -0.51 | 367 | 2.11 | 11.16 | |
| Rating -1.5 to -1.01 | 165 | 1.74 | 9.63 | |
| Rating -2.0 to -1.51 | 52 | 1.96 | 11.68 | |
| Rating -2.0- | 14 | 1.69 | 7.97 | |
| Total | 2345 |
There is a lot to like about this chart. Let's walk through some key points:
1. We get a really nice distribution of starts here:
- 1262 positive vs. 1083 negative
- 1277 (a little more than half) in the 0.50-to-(-0.50) range that we have labeled the "Judgment calls" range.
2. There is also really clear delineation at the top of the table. Starts rated 2.0+ are rare (a little more than one per day on average), and do represent a "cream of the crop" in terms of quality outcomes. But we treat anything 1.0+ as our top tier, and further extend that to include starts in the 0.5-to-0.99 range as "also favorable".
This data validates that tier structure, and also underscores its utility: starts from that "also favorable" tier aren't as good in aggregate as the higher tiers, but there are a lot more of them to choose from. For anyone who will find themselves looking to stream daily starts or two-start weeks after the All-Star Break, these results say that you can make good use of that "0.5 and above" standard in those efforts.
3. One we slide down from those upper tiers into the "Judgment Calls" zone of (0.5 to -0.5), things get much murkier. There is no meaningful difference between the starts just above 0.0 and those just below, which validates our approach to treat those as one pool. Interestingly, the PQS data suggests that we could even extend that statement to include the next tier down (-0.5 to -1.0), although the finer-grained sensitivity of the DK score doesn't back that up. It may be that some of those lower-tier starts are picking up a couple of "cheap" PQS points in otherwise-forgettable outings.
4. It's at the very low end of the scoring system that the ideal distribution of outcomes starts to break down. Well, "break down" is a little too harsh. Let's say the clean distribution "erodes" at the lower end. It's worth noting that the start counts lose their significance pretty quickly here: we're looking at less than one start per day that gets rated lower than -1.5.
It might bear further research into those starts, but I've got one theory from watching the tool each day: it seems like new starters (minor-league callups, reliever spot starts, etc) frequently populate this tier, so it might be that the tool is drawing slightly-too-harsh conclusions based on incomplete data.
Still, it's hard to look at these lower-end outcomes and think there's any sort of buying opportunity here. After all, these are still pretty bad numbers, even if a little less awful than the pre-game rating represented. You will want to have a very good reason for defying these ratings to start a pitcher with a rating below -1.5.
New findings
Now that the utility of the overall matchup ratings is confirmed, we can take a closer look at the category based subscores. As a reminder from the original research piece, the overall matchup score is derived from four component scores measuring the fantasy components of an SP's outing: strikeouts, ERA, WHIP, and Wins. In addition to presenting the overall ratings to guide decision-making, we are also presenting the component scores as additional data points.
Using the same structure as above, we can evaluate the component scores in the same format as the overall scores.
First, strikeout ratings, where "AvgK" is the number of strikeouts each game—not to be confused with K/9:
| K ranges | count | AvgK | |
| Rating 2.0+ | 231 | 7.44 | |
| Rating 1.5 to 1.99 | 162 | 6.41 | |
| Rating 1.0 to 1.49 | 258 | 5.47 | |
| Rating 0.50 to 0.99 | 394 | 5.04 | |
| Rating 0.0 to 0.49 | 446 | 4.80 | |
| Rating -0.50 to -0.01 | 411 | 4.34 | |
| Rating -1 to -0.51 | 209 | 4.50 | |
| Rating -1.5 to -1.01 | 116 | 4.16 | |
| Rating -2.0 to -1.51 | 87 | 3.61 | |
| Rating -2.0- | 30 | 3.97 | |
| Total | 2344 |
This is a nearly identical distribution pattern as the overall ratings above. The 2.0+ tier is in a class by itself. It's typically only aces who sniff that rarified air, but any time a lesser-quality SP sneaks into that top shelf, you should be chasing him. As you slide down the tiers from there, the strikeout output decays pretty normally.
Note that unlike the overall ratings above, here we do find some separation in the buckets that we lump together as "Judgment Calls." If strikeouts are your priority, you will want to stick with the positive ratings only. That isn't even that restrictive, as the ratings do tilt to the positive side (nearly 2/3 of the starts rate to the positive side for strikeouts... which makes sense, as virtually everyone is a strikeout pitcher these days.)
Next, Wins:
| W ranges | count | WinProb | |
| Rating 2.0+ | 79 | 0.53 | |
| Rating 1.5 to 1.99 | 95 | 0.39 | |
| Rating 1.0 to 1.49 | 167 | 0.46 | |
| Rating 0.50 to 0.99 | 261 | 0.40 | |
| Rating 0.0 to 0.49 | 391 | 0.34 | |
| Rating -0.50 to -0.01 | 407 | 0.33 | |
| Rating -1 to -0.51 | 351 | 0.32 | |
| Rating -1.5 to -1.01 | 256 | 0.27 | |
| Rating -2.0 to -1.51 | 160 | 0.18 | |
| Rating -2.0- | 178 | 0.25 | |
| Total | 2345 |
For measurement purposes here, we're tracking Wins as a score of 1, and Losses and No Decisions as 0. So if your league penalizes you for Losses, we aren't accounting for that in the above table.
This is our first finding that is mildly disappointing. The tool isn't really doing much for us to crack the ages-old riddle of chasing Wins. The ratings distribution forms a rather tall bell curve, with some 2/3 of these Wins rating in the (-1.0 to 1.0) range. And in that tier, there is only minor variation in Win probability as compared to the higher and lower tiers.
The bottom line here: Wins are still evil.
What about those of you who are primarily interested in ratio protection, or those of you who play sim formats? Let's look at ERA and WHIP scores:
| ERA | count | ERA | |
| Rating 2.0+ | 151 | 2.87 | |
| Rating 1.5 to 1.99 | 143 | 3.15 | |
| Rating 1.0 to 1.49 | 280 | 3.75 | |
| Rating 0.50 to 0.99 | 334 | 4.08 | |
| Rating 0.0 to 0.49 | 431 | 4.06 | |
| Rating -0.50 to -0.01 | 450 | 4.31 | |
| Rating -1 to -0.51 | 325 | 4.39 | |
| Rating -1.5 to -1.01 | 144 | 5.08 | |
| Rating -2.0 to -1.51 | 61 | 4.67 | |
| Rating -2.0- | 26 | 7.04 | |
| Total | 2345 |
| WHIP | count | WHIP | |
| Rating 2.0+ | 193 | 1.02 | |
| Rating 1.5 to 1.99 | 143 | 1.11 | |
| Rating 1.0 to 1.49 | 257 | 1.23 | |
| Rating 0.50 to 0.99 | 355 | 1.26 | |
| Rating 0.0 to 0.49 | 461 | 1.30 | |
| Rating -0.50 to -0.01 | 394 | 1.35 | |
| Rating -1 to -0.51 | 289 | 1.34 | |
| Rating -1.5 to -1.01 | 162 | 1.46 | |
| Rating -2.0 to -1.51 | 52 | 1.33 | |
| Rating -2.0- | 38 | 1.50 | |
| Total | 2344 |
We end on a high note here, as these two table show the clean, classic stepladder pattern between tiers that we want to see in a tool.
Conclusion
Overall, the news here is very good. The findings from our extensive back-testing in our initial research, and our early-season initial testing, hold up very well in this large-sample test.
In looking at the category-level scores, the news is mostly good as well. The one disappointment is that the tool isn't exactly a divining rod for finding pitcher Wins. But it does very well in rating strikeout opportunities, as well as ratios.
For those of you thinking about using these scores to chase spot starts in the second half of the season, the ERA/WHIP totals immediately above provide some interesting opportunities. In theory, you can use those tables as an "expected ERA/WHIP return" in judging whether to use a particular spot start, or to set a threshold for spot starts you will chase.
For instance, let's suppose your team ERA currently sits at around 3.75, and with a little bit of math relative to your league standings, you calculate that you can afford to chase spot starts in search of additional Wins and K's, as long as those spot starts don't yield an ERA worse than 4.10. The ERA table above says that, based on the first half data, if you limit your spot starts to ratings of 0.50 or better, the aggregate ERA from your spot starts should stay within the range you calculated to be acceptable.
To summarize, a half-season's worth of data says that this tool is doing everything we could have reasonably hoped for. Use it confidently over the balance of the season.
More From GM's Office

Each baseball season brings tweaks and changes, to both players (we're looking at you, Randy Vásquez!) and our site toolbox and staff. Here are some BaseballHQ updates.
Apr 24 2026 8:30am
Apr 24 2026 8:30am

Our favorite late-March tradition returns: Brent and Ray spent Opening Day watching every game and riffing their observations...
Mar 27 2026 8:51am
Mar 27 2026 8:51am

Our annual exercise of polling the BaseballHQ staff to get their answers to burning questions.
Mar 21 2026 3:03am
Mar 21 2026 3:03am

UPDATE: Staffer Alain de Leonardis was recognized for his NL East PT Tomorrow column as the Best Baseball Series of 2025 by the Fantasy Sports Writers Association!
FREE
Feb 27 2026 5:02pm
FREE
Feb 27 2026 5:02pm

March Madness isn't a basketball term around here... today we have some projections data updates and other site tips to make sure you're getting the most out of your subscription in these critical days of draft season.
Feb 27 2026 3:11am
Feb 27 2026 3:11am

