Apr 26 2025 3:09am
Very early command sub-indicator surgers, 2025
Apr 26 2025
It's still risky to put significant stock into early-season skills, especially aggregate measures like strikeouts and walks. But looking into the components that drive them can be a helpful early-season exercise, since they represent larger sample sizes.
These starting pitchers have increased their swinging strike rates the most from 2024 to 2025 (min 20 IP each season):
| 2024 | 2025 | Δ | ||||||||
| Name | Lg | SwK% | FpK% | Ball% | SwK% | FpK% | Ball% | SwK% | FpK% | Ball% |
| Max Meyer | NL | 10.3% | 60% | 38% | 15.4% | 61% | 34% | 5.1% | 1% | -4% |
| Luis L. Ortiz | AL | 8.9% | 61% | 35% | 13.1% | 63% | 35% | 4.2% | 3% | 0% |
| Jameson Taillon | NL | 8.5% | 66% | 34% | 12.6% | 75% | 33% | 4.1% | 9% | -1% |
| Justin Verlander | NL | 9.2% | 58% | 35% | 13.2% | 66% | 35% | 4.0% | 7% | 0% |
| Kyle Freeland | NL | 7.9% | 66% | 33% | 11.7% | 66% | 29% | 3.8% | 0% | -4% |
| Cristopher Sanchez | NL | 11.3% | 66% | 32% | 15.1% | 71% | 34% | 3.8% | 5% | 2% |
| Gavin Williams | AL | 10.4% | 63% | 36% | 14.0% | 51% | 37% | |||
Almost!
You’re just a few clicks away from accessing this feature and hundreds more throughout the year that have a singular goal in mind: Winning your league. Subscribe to BaseballHQ.com here!
Already a subscriber? Sign in here
More From Starting Pitchers
Ben Brown's disappointing 2025 season hid a collection of intriguing skills, making him a young starter to watch this spring.
Feb 14 2026 3:05am
Feb 14 2026 3:05am
Former ace Sandy Alcantara finally looked healthy late in 2025, giving hope that he can recapture his ace-like form in 2026.
Jan 30 2026 3:05am
Jan 30 2026 3:05am
Nick Lodolo's return to health in September reinforced his rotation-anchor upside.
Jan 9 2026 3:05am
Jan 9 2026 3:05am
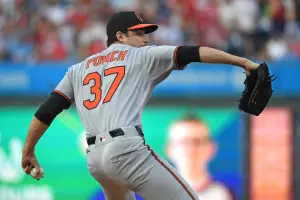
The underlying command gains of Cade Povich in the second half bode well for his ability to take a step forward in 2026.
Sep 6 2025 3:10am
Sep 6 2025 3:10am
Sean Manaea's ugly August ERA hid an impressive foundation of skills that could lead him to a much better showing in September.
Aug 30 2025 3:09am
Aug 30 2025 3:09am


